
What are anchor charts? Learn more below!
What is an Anchor Chart?
An anchor chart is a learning aid that provides a visual for students. You can display them anywhere in your classroom. Many times, teachers can create these on their own, as a poster and used as a reference point throughout the unit or lesson. Students can also have some input in anchor charts as well!
What are the Characteristics of an Anchor Chart?
Anchor charts should be:
Clear and To the Point
When students are using an anchor chart as a reference point, even briefly taking a look at them, students should be able to clearly understand them.
So, anchor charts should be very simple and concise! Just like with interactive lessons, you want to avoid any unnecessary information, and it needs to be constructed in an organized manner!
Visually Appealing
Of course, who wants to look at an ugly poster on the wall? Your students will love a visually appealing anchor chart to look at. As a student, I was always one to be distracted while the teacher was talking. Don’t worry, I still learned and did my work, but my brain would always run away to look at the posters my teachers had on the wall. I’ll never forget that “I will always miss the shots I don’t take” thanks to these!
So, if you have those distracted students like me, it’s great to have some effective, productive, and beautiful wall décor like science anchor charts!
What Does an Anchor Chart Look Like?
As read above, it should be simple and aesthetically pleasing, but what else?
Not all anchor charts look the same, but you should have some of the elements, if not all of them, when you are creating your anchor charts.
Title or Heading
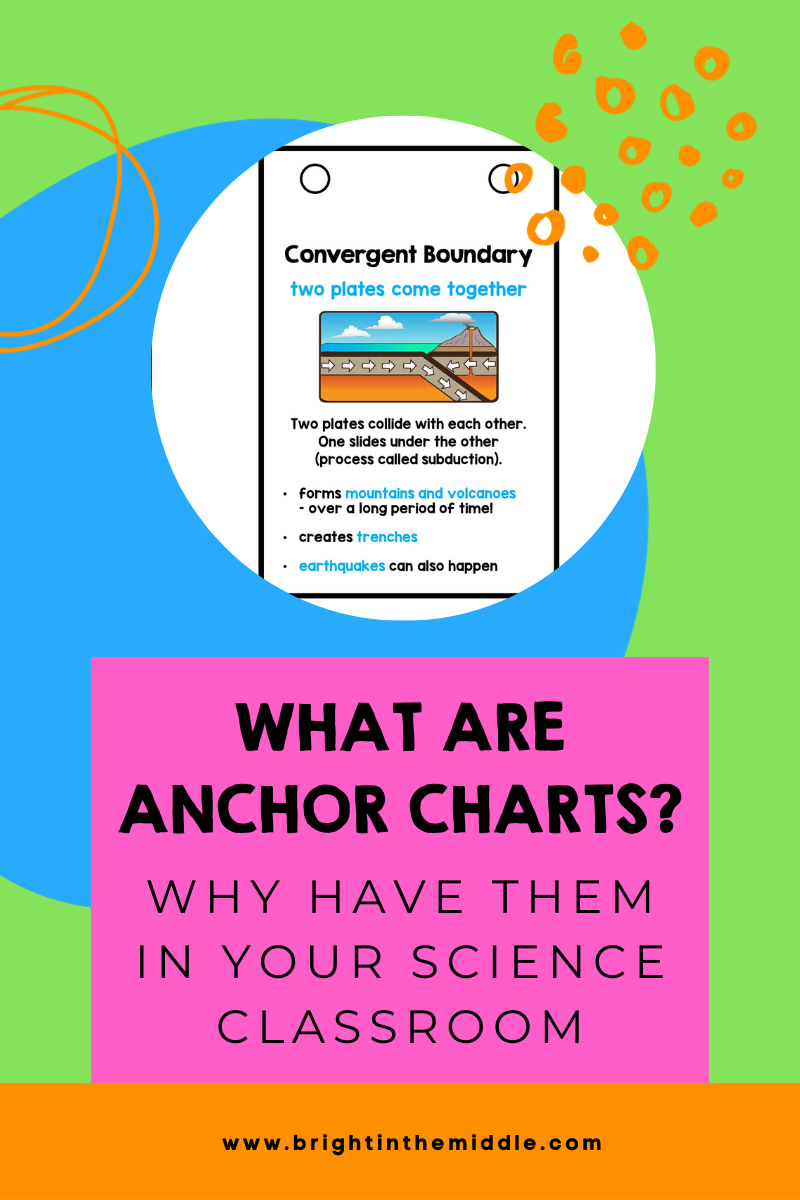
You want to make sure that your students are aware of what the chart is about. If you have a picture of the Earth layer: mesosphere, but have no label or title, what would be the point? Sometimes, a title may not be necessary, but having some sort of headings to organize the information is crucial.

Graphics
Having a bunch of text on a page is in no way visually appealing. You want to have some sort of graphic or clipart picture to help make the anchor chart make sense. For example, it’s great to know that streak is a mineral property and is the color mineral appears in powdered form, but what does that look like?

Highlight Important Information
I’ve already mentioned that it’s important to keep the unnecessary information out of your anchor charts, but what about the most important information? For example, say you have an anchor chart you are creating about the layer of soil called topsoil. You may want to highlight the terms “organic matter”, “many organisms”, “dark”, “most fertile”, and “plant roots”. These should stand out to help reduce student cognitive load and help them remember the most important features of this soil.

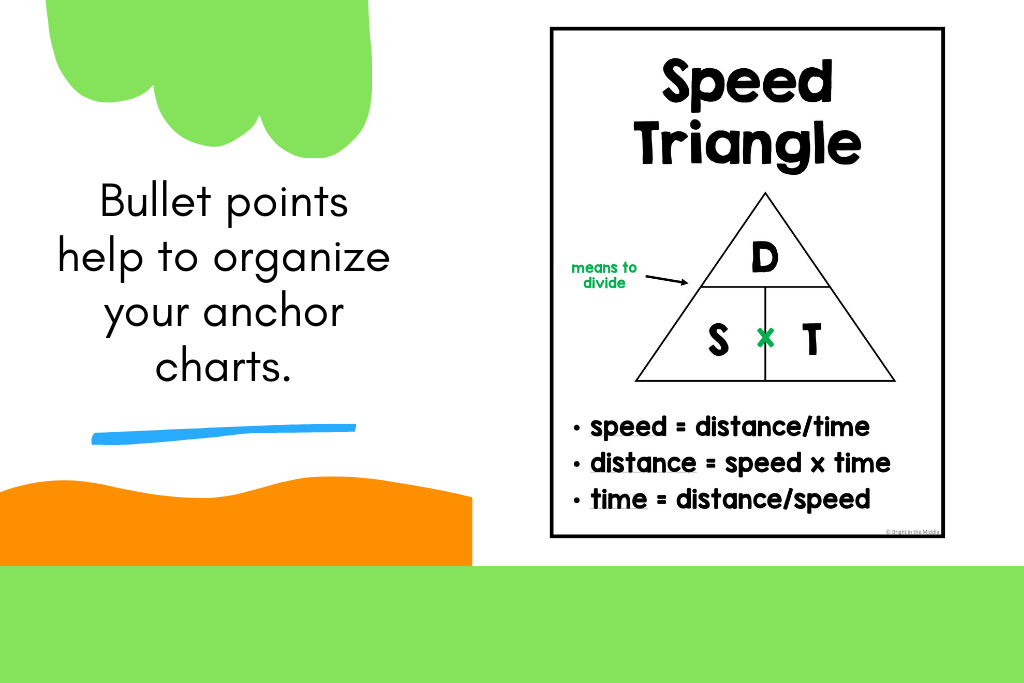
Bullet Points
Bullet points are not always needed, but if you have enough necessary information to put on an anchor chart, you will want to make sure it’s organized! For example, for an anchor chart on the speed triangle, you may want to create bullet points for each of the equations that you can derive from the triangle!
What Are Anchor Charts Use For?
Ok, so you know what anchor charts are and what they can look like in your classroom. You even know that you can hang them on your classroom wall or bulletin board. What else are they used for though? What can anchor charts offer to your students?
To Introduce Concepts
Before you even dive into your lesson, you can have anchor charts displayed on the board, you can have them pasted into your students’ notebooks, or you can even have them neatly placed in a mini-frame on their desk or somewhere else accessible. Students can view them before you even teach them at all. This will greatly assist them in their learning and help make some abstract ideas a little easier to comprehend.
To Explain Processes
Some processes can be complicated, but if you have an anchor chart up for the entire unit or longer, students can continue to observe it and make it easier for them to grasp. Think about the water cycle!
Just as a Reference
Just having this available for students to observe as a constant point of support is great, especially when they are doing independent work!
Why Should You Have Anchor Charts in Your Science Class?
You have already learned that anchor charts are awesome, but why should you have them in your science classroom?
Reference
Ok, maybe I’m repeating the same thing over and over again, but having the visual reference is important for learning science concepts. Some concepts can be very complicated and being exposed to it over and over again can truly help students retain information and help them to gain a deeper understanding of the topic.
Student Engagement
I’ve mentioned a lot about anchor charts being used as a reference, but I haven’t mentioned how great they are as tools of student engagement. Any time that you are engaged in discussion, and you ask students a question that they cannot answer, you can ask them to refer to the anchor chart! Soon, your students will get the hang of it and become more active in class with the “extra help”. They’ll think they are slick, but they are actually learning in the process!
Classroom Décor
Any time that you can decorate your classroom with effective, productive, and visually appealing items, you are winning!
To see more anchor chart examples, check this out!
You can also check them out on TPT.
[…] What are Anchor Charts? […]